Business Intelligence and Reporting

Two people bring two numbers for the same month and both can defend theirs. This page covers what a reporting layer actually is, why dashboards get abandoned, what BI costs an Australian operator, and why the definition of a metric matters more than the chart.

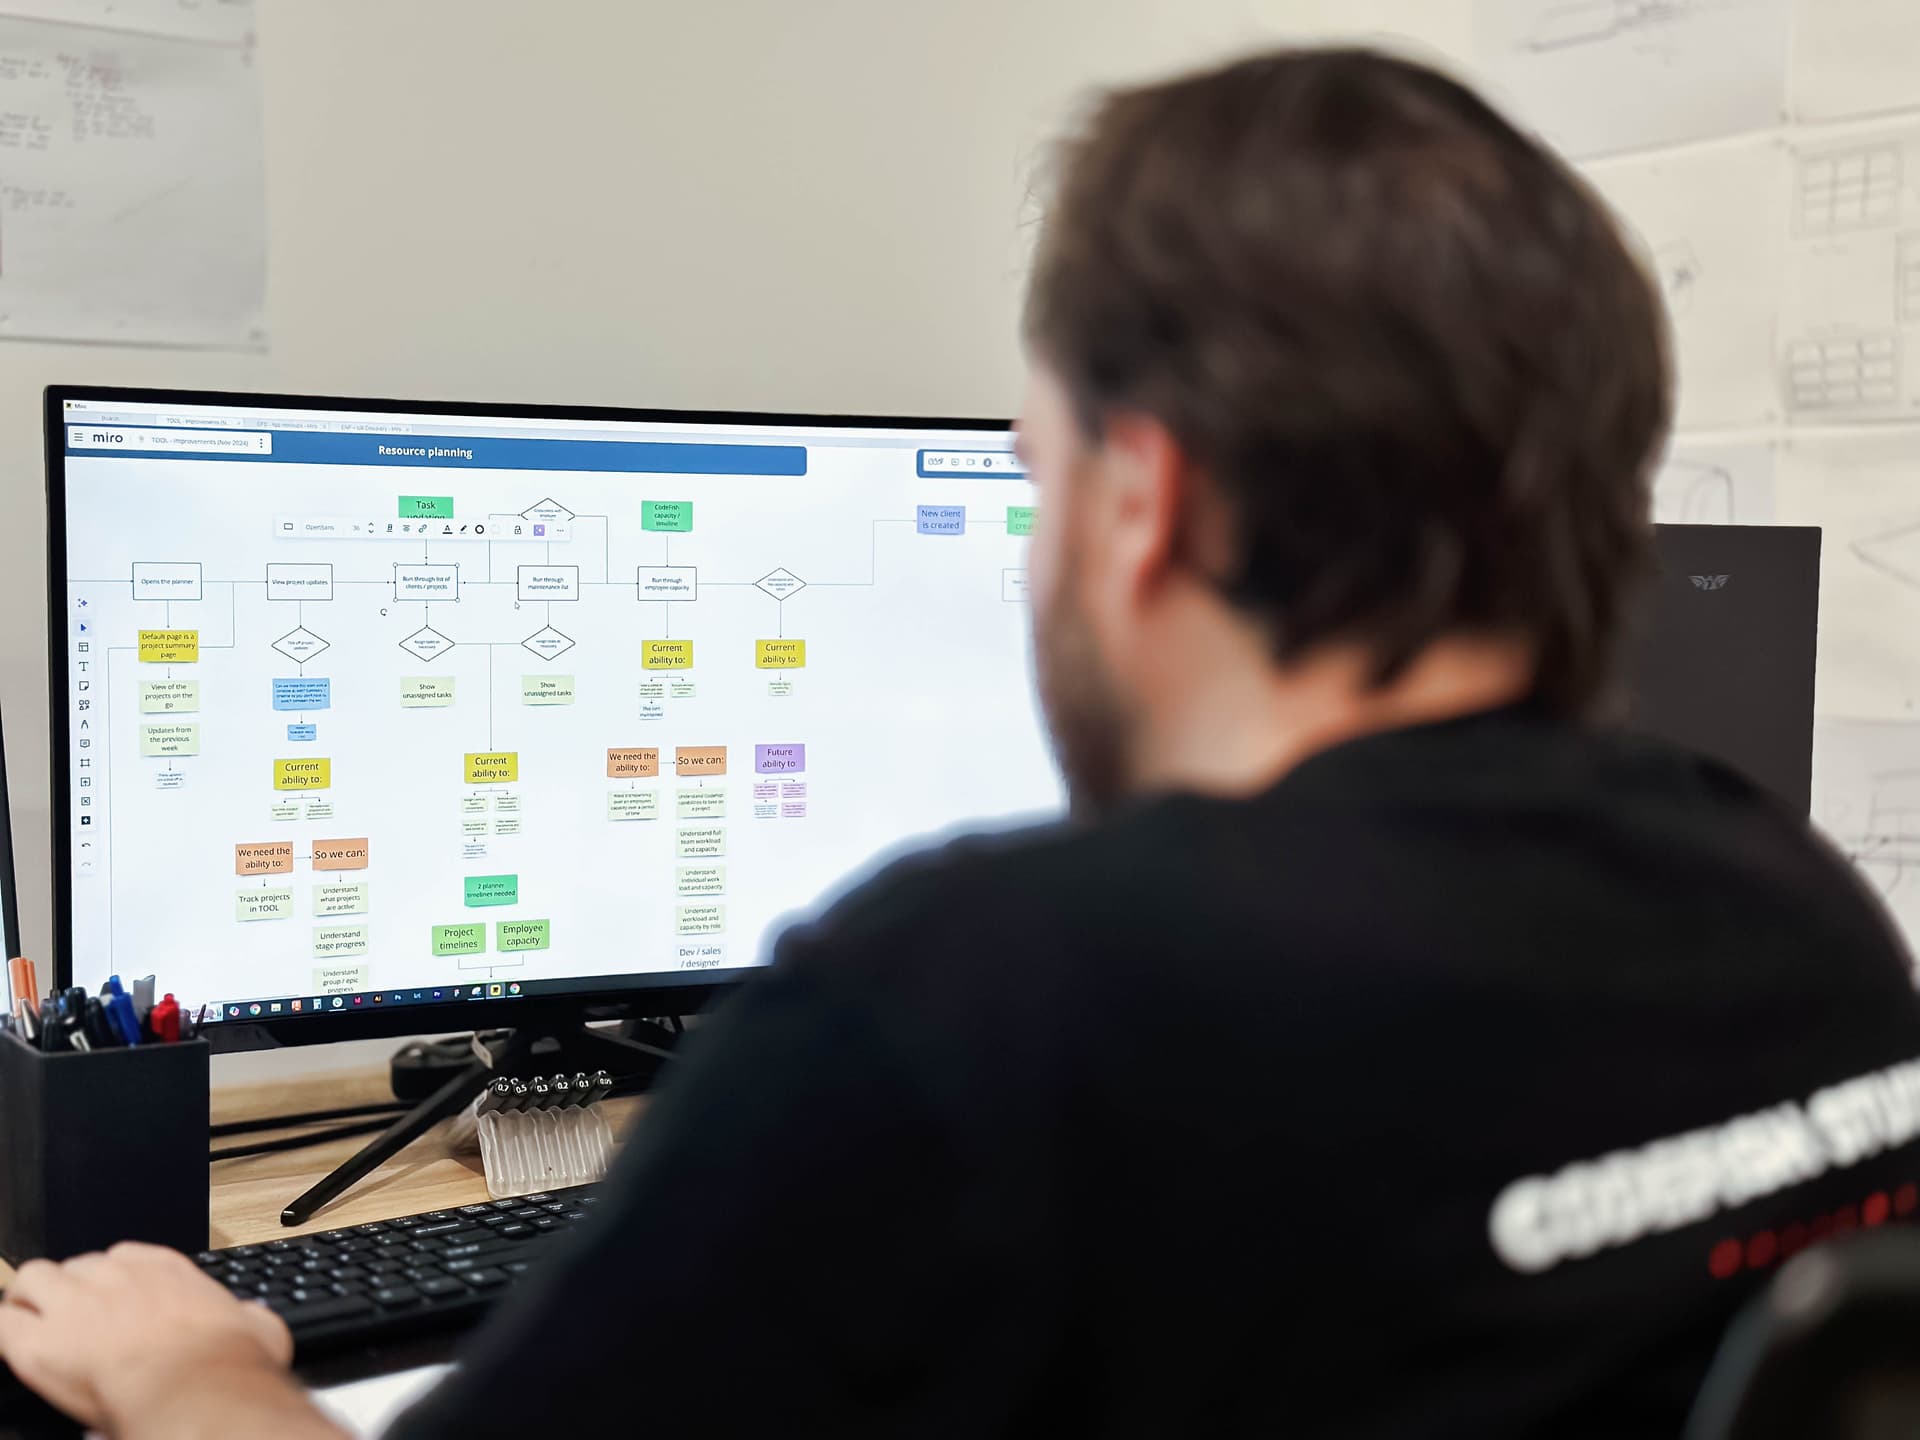
A team member at a monitor reviewing a colour-coded business process flow diagram

What is business intelligence and reporting?

Business intelligence turns the records your systems hold into numbers people act on. It needs three things: an agreed definition for each metric, one place the data is assembled, and views people actually open.

Most businesses have the views and miss the first two. So finance and operations bring different numbers for the same month, and the meeting reconciles instead of deciding.


What a reporting layer actually needs

In this order — a chart built before the definitions are agreed just gives the argument better graphics.

Agreed definitions

What counts as revenue, an active customer, on-time delivery. Written down, owned by a person, and the same in every report. This is the unglamorous half of BI and the half that decides whether the rest is trusted.

One assembled copy of the data

The records pulled out of each source system into one place on a schedule, so nobody is reporting from a live production database or from an export somebody took last Tuesday.

Metrics that mean something

A small set of numbers tied to decisions someone actually makes. A dashboard with forty tiles is a data dump — nobody knows which one to act on, so nobody acts on any of them.

Views built for a role

A line supervisor and a board member need different views of the same business. One screen serving both usually serves neither, and it is the most common reason a rollout stalls.

Freshness people can trust

How current the number is, stated on the screen. Most operational decisions need yesterday, not real time — and a wrong figure delivered instantly is worse than a right one delivered daily.

The honest constraint

Reporting exposes data quality rather than fixing it. If the source systems are inconsistent, the first thing a good dashboard does is show you that — which is useful, and not what people expect to buy.

Buy a BI tool, or build reporting?

Buy the tool. Power BI, Looker Studio and Metabase are mature and cheap. The work worth paying for sits underneath: getting data out of each system reliably, reconciling records that disagree, and writing the definitions down.

The one real build case is reporting inside the tool people already use. A number on a supervisor's screen gets acted on. The same number in a separate portal gets opened weekly at best.

Whiteboard covered in coloured sticky notes grouped under handwritten UX and analysis headings

Do you need a data strategy first?

A short one. It answers four questions: which decisions the business runs on, which numbers they need, which system owns each number, and who is accountable when it is wrong.

That fits on a page. We write it in the workshop, then build the reporting against it.

Two people bring two numbers for the same month, and both of them are right.

What does business intelligence cost?

The licence is the small number. The work underneath is the budget.

Start with a $9,000 workshop

A fixed $9,000 + GST Rapid Insight Workshop works out which decisions the reporting supports and which numbers they need. The list is always shorter than expected.

Licences are cheap

A BI tool costs tens of dollars per user per month. Don't let the licence drive the decision.

Systems drive the cost

Two clean systems is a short project. Six systems that each hold a different customer list is not.

Budget for upkeep

Reporting nobody maintains stops being trusted the first time a number looks wrong. Then people go back to their spreadsheets.

How a reporting project runs

Agree the definitions (2–3 weeks)

Every metric gets a written definition and a named owner before anything is built. This is the stage people want to skip, and skipping it is why the last dashboard is not being used.

A whiteboard covered in colour-coded sticky notes from a UX workshop

Get the data flowing (4–8 weeks)

Scheduled, monitored pulls from each source system into one place, with the reconciliation problems found and fixed here rather than discovered by an executive in a meeting.

The CodeFish Studio workspace in Adelaide, developers working at desks on the studio floor

Ship one view people open daily

One role, one set of decisions, one screen — in use every day. A single trusted view earns more than a full suite launched at once, and it tells you what the second one should be.

Two CodeFish team members talking through a problem across the meeting room table

Reporting questions we get asked

Because they are answering slightly different questions and nobody has written down which one is the company's answer. One system counts revenue at despatch, another at invoice, a third net of credits. All three are correct internally. The fix is a written definition with an owner, applied everywhere — not a better chart.

Buy the tool. Power BI, Looker Studio and Metabase are mature and inexpensive, and a custom charting layer buys you nothing. The work worth paying for is underneath: getting data out of each system reliably, reconciling records that disagree, and agreeing what each metric means.

Not always, and not first. If your reporting draws on two systems at modest volume, a scheduled pull into a reporting database will do the job for a fraction of the cost. A warehouse earns its place when several systems have to be reconciled, history matters, or the reporting load is heavy enough to affect the systems it reads from.

Usually one of three reasons: it showed forty numbers and no decision, someone found a figure they could not explain and stopped trusting all of it, or it lived somewhere people had to remember to go. Reporting gets used when it is small, explainable, and sitting where the work already happens.

Less fresh than people ask for. Most operational decisions run on yesterday's numbers, and daily loads are far cheaper and more reliable than streaming. Where a decision genuinely happens in the moment — a line stopping, a job going late — that number belongs inside the operational system, not in a BI portal.

Partly. Reporting will expose the inconsistencies rather than fix them, and that visibility is worth having early. The practical order is to fix the fields the first set of metrics depends on, get the reporting live, and let it show you which of the remaining problems are actually costing anything.

Ready to build something great?

Local partners, global standards – full service design and development.